
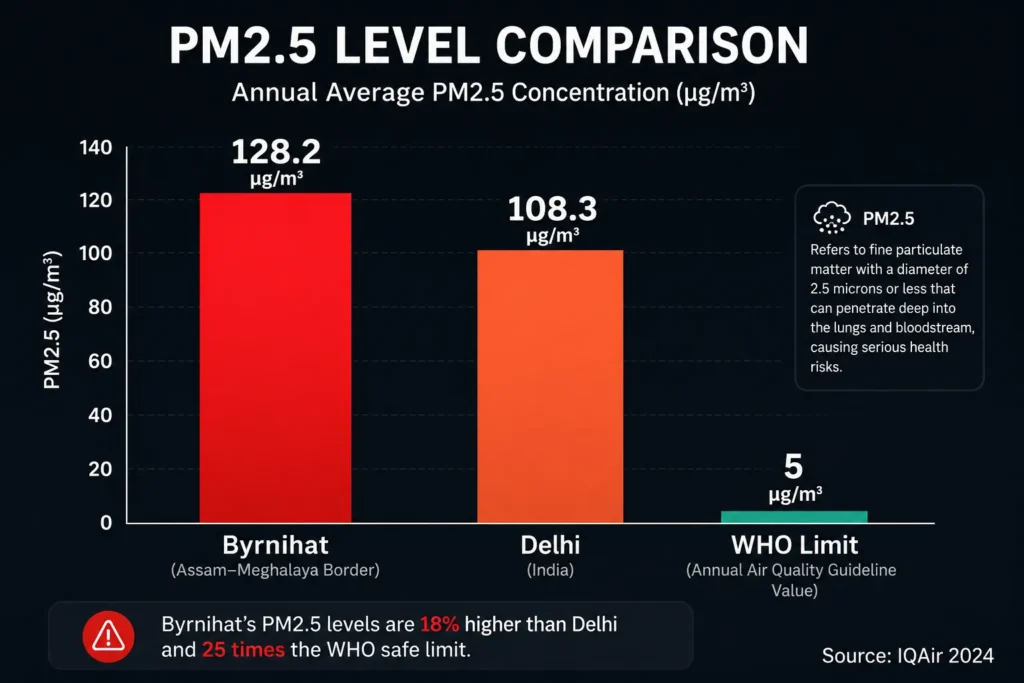
Byrnihat — a tiny industrial town on the Assam–Meghalaya border — has been ranked the most polluted city in the world by IQAir for the year 2024, with PM2.5 levels of 128.2 µg/m³, over 25 times the WHO limit. But even with factory shutdowns and government action, the air hasn’t cleared. Here’s the complete story…
Most people think of Delhi when they hear “air pollution in India.” But since 2023, a small industrial town that most Indians have never even heard of has been consistently ranked worse than Delhi — and in 2024, worse than every city on the planet.
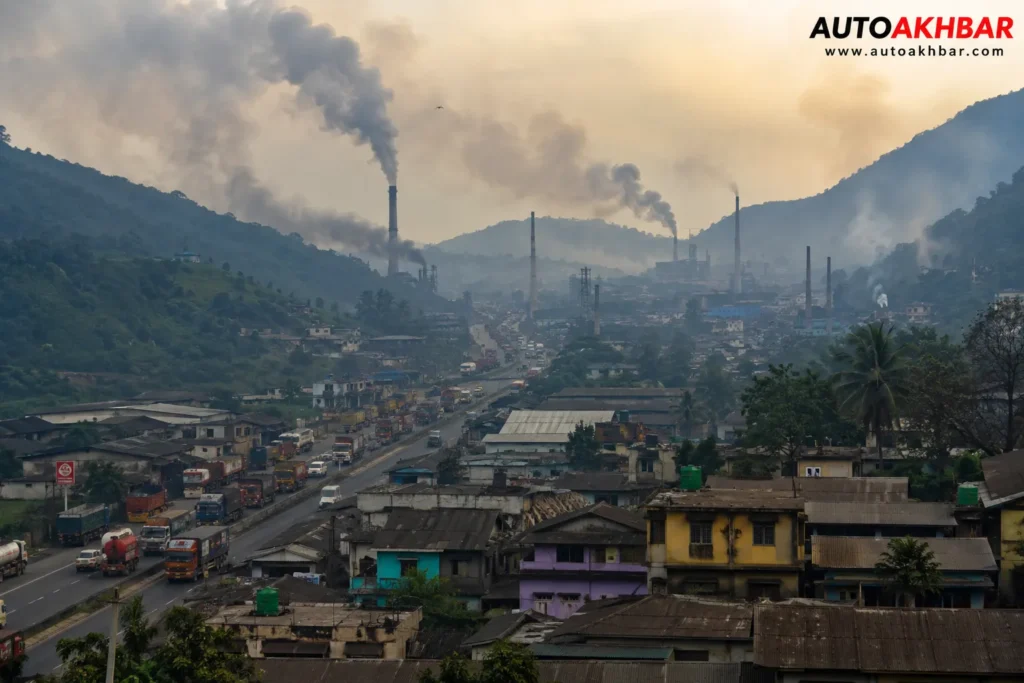
Its name is Byrnihat — and if you’re encountering this name for the first time, you’re not alone. It’s a town of roughly 40,000–50,000 people, tucked into the hills on the Assam–Meghalaya border, about 20 km from Guwahati. No metro, no flyovers, no sprawling slums. Just factories, a busy highway, and hills that keep the smoke from going anywhere.
In March 2025, Swiss air quality monitoring firm IQAir released its annual World Air Quality Report for 2024 — and Byrnihat topped the global list with a staggering annual average PM2.5 concentration of 128.2 µg/m³. That’s more than 25 times the WHO safe limit of 5 µg/m³. And by mid-2025, CREA (Centre for Research on Energy and Clean Air) confirmed Byrnihat was still India’s most polluted city in the first half of 2025, with PM2.5 averaging 133 µg/m³ — higher than even its 2024 annual average.
So how did this happen? Why can’t the government fix it? And what does 2026 actually look like on the ground? Let’s break it all down.
Table of Contents
📍 Where Exactly Is Byrnihat?
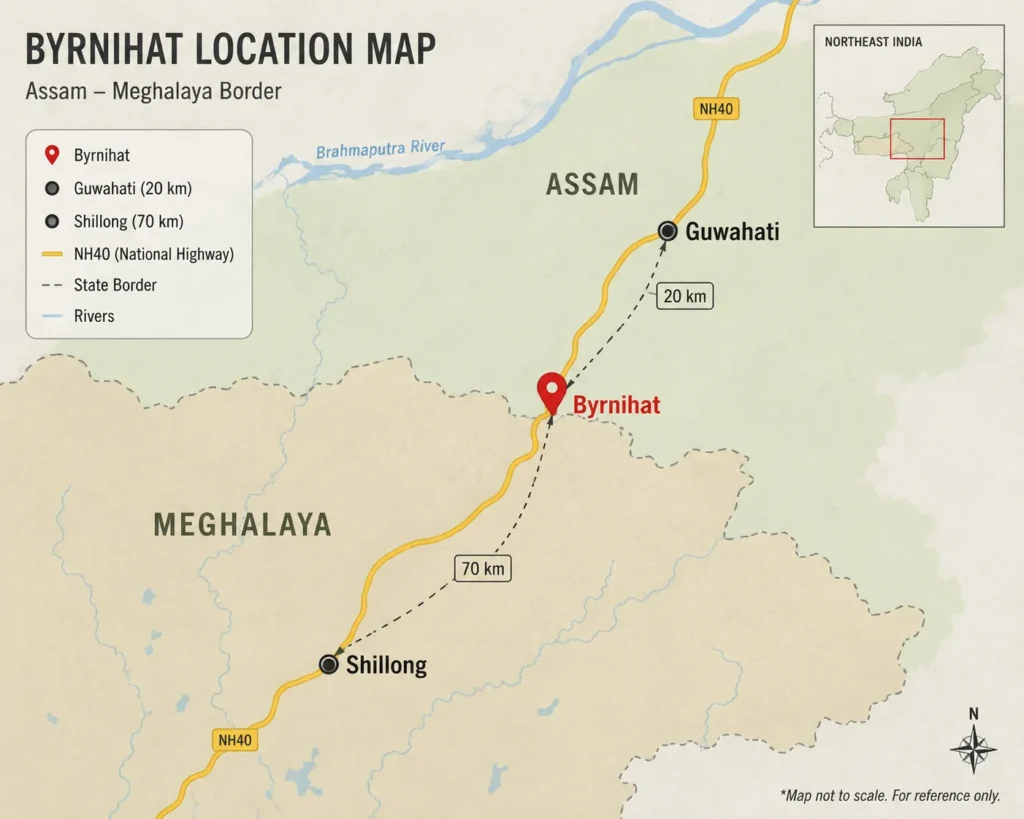
Byrnihat (also spelled Barnihat on the Assam side) sits right on the state border between Meghalaya and Assam in Northeast India. This isn’t a technicality — it’s the root cause of almost every problem the town faces.
- Distance from Guwahati: ~14–20 km
- Distance from Shillong: ~65–90 km
- State jurisdiction: Ri-Bhoi district (Meghalaya) + Kamrup Metropolitan district (Assam)
- Highway: NH-40 (formerly NH-6) passes directly through the town
The town is sandwiched between the Meghalaya hills to the south and the Assam plains to the north. This creates a natural valley, or “bowl,” that traps air. When factories and trucks emit pollutants, the surrounding hills prevent the smoke from dispersing. Wind speeds in the valley are low, and during winter, temperature inversions make the situation even worse — a warm air layer acts like a lid, sealing the pollution close to the ground.
Geography = Problem multiplier. Byrnihat’s bowl-shaped terrain doesn’t just make pollution bad — it makes it persistent. Even on days when emission sources slow down, the trapped air keeps the AQI high.
🏭 What Industries Are in Byrnihat?
Byrnihat became an industrial hub in the late 1990s, and growth accelerated further after 2007 when the Centre offered incentives to attract investment to the Northeast. The town hosts a government-built industrial estate called the Export Promotion Industrial Park (EPIP), spread across 256 acres adjacent to the Umtrew River.
As of 2025, the greater Byrnihat region has approximately 80 industrial units. Here’s how they break down:
| Side of Border | Total Units | Red Category (High Pollution) | Orange Category |
|---|---|---|---|
| Assam (Tamulikuchi area) | 39 | 20 | 15 |
| Meghalaya (EPIP + 13th Mile) | 41 | 5 | 22 |
The industries that contribute the most to pollution include:
- Coke ovens and ferro-alloy plants — the single biggest source of PM2.5
- Iron and steel units
- Cement factories
- Distilleries
- Stone-crushing units (along the highway)
Most of the high-pollution “red category” industries are on the Assam side — a fact that Meghalaya CM Conrad Sangma has repeatedly highlighted. This cross-border dynamic is at the heart of the governance failure: each state’s pollution control board can only act within its own jurisdiction.
Apparently ethanol causes less pollution, they said……Here is the Truth…..STARK😷😷
by u/Boss_withCrown2 in CriticalThinkingIndia
The Numbers: How Bad Is the Pollution, Really?
Let’s put the figures in perspective with a simple comparison:
| Location / Standard | Annual Average PM2.5 | vs. WHO Limit |
|---|---|---|
| 🔴 Byrnihat (2024, IQAir) | 128.2 µg/m³ | 25.6× over limit |
| 🔴 Byrnihat (H1 2025, CREA) | 133 µg/m³ | 26.6× over limit |
| 🟠 Delhi (2024) | 108.3 µg/m³ | 21.7× over limit |
| 🟡 India NAAQS Daily Limit | 60 µg/m³ | 12× over WHO limit |
| 🟢 WHO Annual Safe Limit | 5 µg/m³ | — |
To put it in a more relatable way: breathing the air in Byrnihat for one year is the equivalent of smoking dozens of cigarettes a day in terms of fine particulate exposure. According to CREA’s 2025 report, Byrnihat exceeded India’s own NAAQS daily limit on 278 out of 356 monitored days.
Also Check WHO PM2.5 guidelines
On 25 October 2023, the Central Pollution Control Board (CPCB) recorded Byrnihat’s AQI at 302 — solidly in the “Severe” category. During peak winter periods, the AQI can climb even higher.
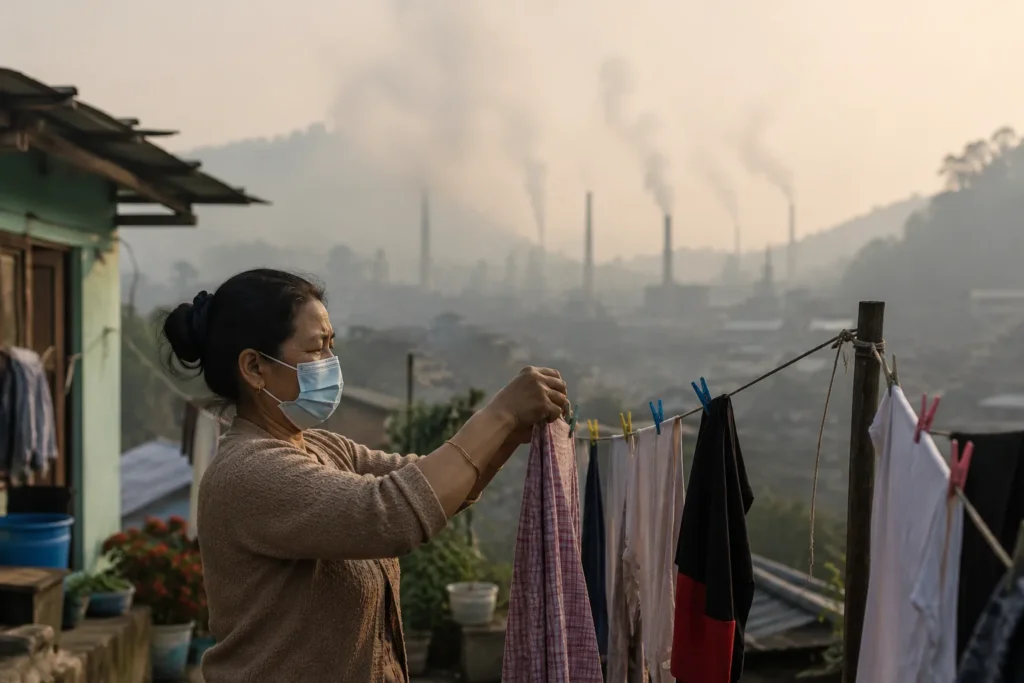
“Even if we close all our windows, doors and ventilators, the dust enters. We can’t dry our clothes outside, children can’t play outside — there is just no respite from the dust.” — Alin Syngkli, homemaker, Rajabagan area, Byrnihat
🌫️ What Causes Byrnihat’s Extreme Pollution? (All Sources Explained)
It’s not just one industry or one vehicle. Byrnihat’s pollution is a perfect storm of multiple overlapping sources:
1. Industrial Emissions (Primary Cause)
Coke ovens, ferro-alloy plants, and cement factories emit enormous quantities of PM2.5, PM10, sulphur dioxide (SO₂), and nitrogen oxides (NOₓ). Many units have been found operating without functional emission control devices. A 2024 Centre for Science and Environment report noted that several ferro-alloy units submitted compliance certificates despite visible emission plumes visible from the highway.
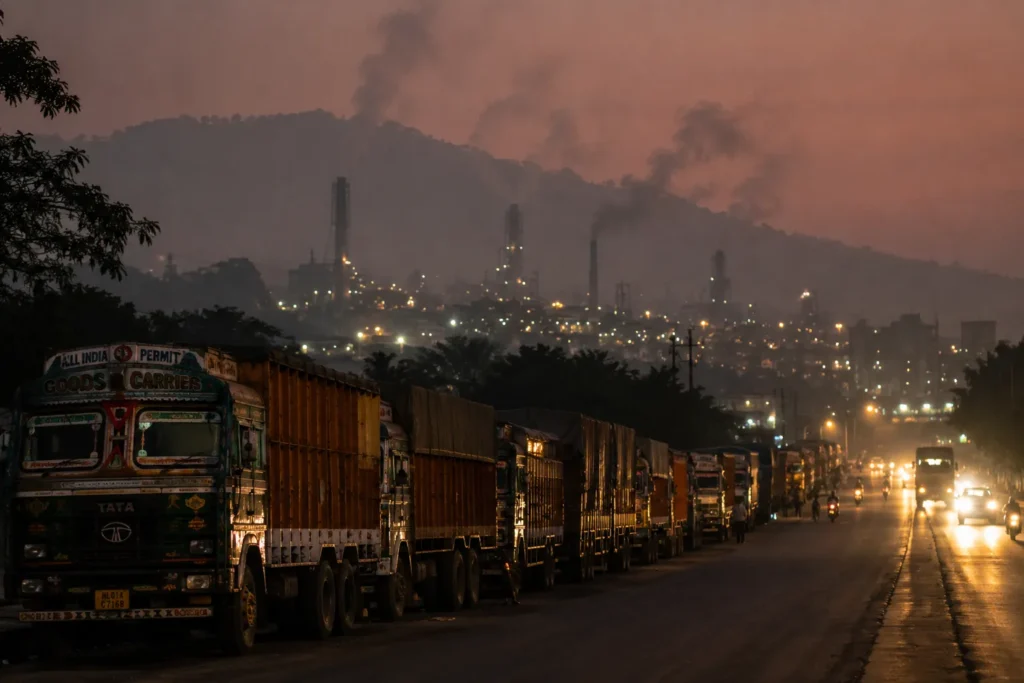
2. Heavy Diesel Trucks on NH-40
Trucks aren’t allowed to enter Shillong during the day, so they queue up in and around Byrnihat, idling for hours. A March 2025 study by CSIR-NEERI (Council of Scientific and Industrial Research–National Environmental Engineering Research Institute) found that vehicular emissions account for 14% of PM10 and 11% of PM2.5. At night, thousands of trucks ignite their engines simultaneously — creating a spike in local emissions.
3. Road Dust (Bigger Than You’d Think)
This is the most surprising finding. The same CSIR-NEERI study found that road dust contributes 63% of PM10 levels. Unpaved shoulders, coke dust falling off trucks, and stone-crushing units along the highway all contribute to this dust load. During dry months, dust alone can push PM2.5 into the “poor” category.
4. Topography and Weather (The Trap)
The bowl-shaped valley blocks wind and keeps emissions close to the ground. In winter, temperature inversions act as a ceiling, preventing pollutants from rising and dispersing. This means even a moderate amount of industrial activity results in extremely high concentrations at ground level.
5. Household Biomass Burning
Surrounding villages still use wood and biomass for cooking and heating. Despite the PM-UJJWALA scheme providing LPG connections, actual usage hasn’t fully replaced traditional fuels. Open burning of agricultural and municipal waste also adds to the problem.
6. Groundwater Contamination (An Underreported Crisis)
It’s not just the air. Byrnihat’s groundwater has also been found to be contaminated — likely from industrial effluents seeping into the Umtrew River and nearby water sources. Agricultural produce from Byrnihat is actively avoided by consumers in Guwahati’s markets due to contamination concerns.
Also Read : Is Tesla Leaving India? The Full Truth Behind the 2026 Manufacturing Exit
🏛️ The Governance Problem: Two States, Two Boards, Zero Coordination
This is where Byrnihat’s crisis gets uniquely complicated — and frustrating.
The town sits on a state border. This means pollution from one side directly affects the other, but each state’s pollution control board (the Meghalaya State PCB and the Assam PCB) can only regulate industries within their own state. There’s no mechanism for joint enforcement.
The result? A blame game:
- Meghalaya CM Conrad Sangma has pointed to the 20 red-category industries on the Assam side vs. only 5 in Meghalaya as the bigger problem.
- Meghalaya’s data (from MSPCB’s 4 monitoring stations) showed a PM2.5 annual average of 50.1 µg/m³ for 2024 — less than half of IQAir’s 128.2 reading.
- This discrepancy has led to a debate: IQAir’s monitoring station is believed to be on the Assam side, which may capture more industrial emissions.
CM Sangma has written to Assam CM Himanta Biswa Sarma requesting a joint action plan, but as of early 2026, no formal bilateral coordination mechanism is in place.
Key Structural Issue: The North East Industrial Development Scheme (NEIDS) 2017 still offers fiscal subsidies to polluting industries in the region without linking incentives to pollution performance — making it profitable for factories to set up here without meeting emission standards.
⚕️ Health Impact: What Pollution Is Doing to Byrnihat’s Residents
The health consequences of living in Byrnihat are severe and well-documented. PM2.5 particles are small enough to pass through the lungs and enter the bloodstream, causing damage to organs far beyond the respiratory system.
Documented health problems in Byrnihat’s population include:
- Chronic respiratory diseases (asthma, bronchitis, reduced lung capacity)
- Eye irritation and conjunctivitis
- Skin rashes and dermatitis
- Tuberculosis
- Cardiovascular disease and heart problems
- Cancer (with long-term exposure)
Data from the Meghalaya Directorate of Health Services shows a 40% rise in respiratory illness in Ri-Bhoi district since 2018. Locally, residents like Augustine Sangma (a farmer) have described children unable to sleep through the night due to smoke, while others say seasonal respiratory flare-ups have become a year-round problem.
Children and the elderly are at the highest risk, but even factory workers — who are supposed to be protected by occupational health norms — frequently report health problems. The closure of coke plants following pollution crackdowns has also caused unemployment in a town where many residents work in the industrial sector, creating a difficult trade-off between public health and livelihoods.
🏗️ What the Government Has Done (And Why It Hasn’t Worked)
Multiple layers of government have been involved — and multiple rounds of action have been taken. Yet pollution remains stubbornly high.
Actions Taken:
- CPCB listing: Byrnihat is classified as a non-attainment city under the National Clean Air Programme (NCAP), which targets a 40% PM reduction by 2026 from the 2017 baseline.
- Factory inspections: MSPCB inspected 10 units in September 2024; 6 were found non-compliant and issued closure notices.
- Factory closures: 7 units were shut in January–February 2025 for violations including malfunctioning emission control devices and failure to share data. As of February 2026, 15 industrial units on the Assam side have been shut since Byrnihat topped pollution rankings.
- New monitoring station: In December 2025, Meghalaya CM Conrad Sangma inaugurated a new Continuous Ambient Air Quality Monitoring System (CAAQMS) in Ri-Bhoi district to improve real-time surveillance.
- CSIR-NEERI study: The MSPCB commissioned an Emission Inventory & Source Apportionment study to better understand where the pollution is actually coming from.
- NGT and Meghalaya High Court: Both have issued directions on Byrnihat pollution, adding judicial pressure on the state and central governments.
Why Hasn’t It Worked?
Here’s the uncomfortable truth: even after 7 factory closures in early 2025, AQI data from the CPCB’s SAMEER app showed readings in the “Severe” range (300–400) during the shutdown period. This suggests that factories alone aren’t the whole story — road dust, vehicle emissions, and geography are contributing far more than authorities initially assumed.
There’s also a monitoring problem. For years, Byrnihat had very few operational air quality monitoring stations. Data gaps meant that the crisis wasn’t visible in government databases — even as residents were suffocating. The new CAAQMS station (installed December 2025) is a step forward, but real-time, multi-point monitoring across both the Assam and Meghalaya sides is still lacking.
📡 IQAir Data vs Government Data: Why the Numbers Don’t Match
This is one of the most-asked questions about Byrnihat — and the answer is genuinely complex.
IQAir (2024 report): PM2.5 annual average = 128.2 µg/m³ (based on monitoring station data, likely positioned on the Assam side).
MSPCB (Meghalaya government, 2024): PM2.5 annual average = 50.1 µg/m³ (based on 4 Meghalaya-side stations).
Both figures are genuinely alarming — even 50.1 µg/m³ is 10 times the WHO safe limit. But the difference reveals an important truth: pollution in Byrnihat is spatially uneven. Industrial zones on the Assam side may be significantly worse than residential areas on the Meghalaya side. A single monitoring station placed near an industrial cluster will return very different data from one placed in a village 2 km away.
This is why MSPCB’s chairman R. Nainamalai stated in January 2026 that pollution levels in the Meghalayan part of Byrnihat had dropped to “moderate” after several red-category closures — a statement that doesn’t contradict IQAir’s global ranking if the worst emissions are still occurring on the Assam side.
📅 Has Byrnihat’s Pollution Improved in 2025–2026?
The honest answer: partially, and only in parts of the town.
- February 2025: Meghalaya-side AQI briefly dropped to 97 (“Satisfactory”) following factory shutdowns on that side.
- H1 2025 (CREA data): Byrnihat’s PM2.5 average was 133 µg/m³ — actually higher than 2024’s annual average of 128.2. Delhi was a distant second at 87 µg/m³.
- January 2026 (MSPCB chairman): Meghalayan part of Byrnihat has moderated after red-category closures.
- CPCB SAMEER app data: AQI was in “Severe” range (300–400) even during factory shutdowns — indicating road dust and traffic remain unaddressed.
The CREA 2026 ranking confirmed Byrnihat as India’s most polluted city again in 2025. There has been no sustained improvement — only localized, temporary dips following enforcement actions that don’t address the full source mix.
🌍 Can Byrnihat’s Pollution Spread to Guwahati?
Yes — and this is an underappreciated risk. Byrnihat is only 14–20 km from Guwahati, and prevailing winds can carry fine PM2.5 particles over considerable distances. While Guwahati has its own industrial and vehicular pollution sources, PM2.5 from Byrnihat can contribute to the city’s background pollution levels, particularly during winter when the valley’s trapped emissions spill over during wind shifts.
Residents of the Jorabat and Khanapara areas of Guwahati have anecdotally noted increased haze on days when wind patterns shift toward the city — though no formal source apportionment study has yet isolated Byrnihat’s contribution to Guwahati’s AQI.
🛡️ What Can Byrnihat Residents Do to Protect Themselves?
While systemic change is needed, here’s what residents can do right now to reduce exposure:
- Wear N95 or FFP2 respirator masks outdoors — cloth masks filter very little PM2.5.
- Use air purifiers indoors with HEPA filters, especially in bedrooms and children’s rooms.
- Keep windows and doors closed during peak pollution hours (early morning and night when trucks ignite, and winter evenings during temperature inversions).
- Check AQI before outdoor activity — use the CPCB SAMEER app for real-time local data.
- Avoid outdoor exercise when AQI is above 150 (Unhealthy). Do not run or cycle near the highway.
- Plant pollution-absorbing trees around homes — species like neem and peepal offer some particulate absorption.
- Get regular health check-ups for respiratory and cardiovascular function, especially for children and elderly family members.
- Report violations to MSPCB or Assam PCB through their online portals or CPCB’s complaint mechanism.
🔮 Long-Term Solutions: What Would Actually Fix Byrnihat?
Factory closures and inspections alone haven’t worked. A genuine fix for Byrnihat needs to address all the overlapping causes simultaneously:
- Multi-point, real-time air quality monitoring across both the Assam and Meghalaya sides, with publicly accessible data — so action can be data-driven rather than reactive.
- Joint Assam–Meghalaya pollution control mechanism with a shared enforcement body for the border region.
- Strict emission technology mandates: All remaining coke and ferro-alloy units must install and actually operate bag filters and electrostatic precipitators — with continuous emission monitoring systems (CEMS) feeding into a public dashboard.
- Road dust suppression: Paving of unpaved road shoulders, mandatory covering of coke-laden trucks, and mechanized road sweeping on NH-40 through the town.
- Truck traffic management: Dedicated truck waiting areas away from residential zones, electric alternatives for short-haul cargo in the future.
- Link NEIDS subsidies to emission performance: Industries should only continue to receive fiscal incentives if they meet emission standards — a proposal not yet adopted by DPIIT.
- Green buffer zones: Mandate industrial setback zones with tree cover between factories and residential areas.
- Transition support: Workers displaced by factory closures need retraining and alternative livelihood schemes — otherwise communities will resist enforcement actions.
🚗 The Automobile Angle: Why This Matters for India’s Roads
For AutoAkhbar readers, there’s a very direct connection here. Byrnihat’s pollution story highlights a problem that’s playing out across India’s industrial highways — old, poorly maintained diesel commercial vehicles operating without proper emission control systems.
The thousands of BS-III and older diesel trucks that queue through Byrnihat daily are a rolling pollution crisis. India’s push toward BS-VI emission norms for commercial vehicles is a step in the right direction, but enforcement on existing older fleets remains weak. Towns like Byrnihat — sitting at the intersection of industrial zones and major freight routes — pay the heaviest price.
The National Green Hydrogen Mission, FAME-II subsidies, and India’s EV push are important long-term solutions for road transport emissions. But in the near term, stricter enforcement of BS-VI norms on commercial vehicles, mandatory PUC compliance, and pushing diesel trucks off routes through populated areas would make an immediate difference not just in Byrnihat, but in dozens of similar towns across India.
If you want to understand what unregulated vehicular pollution looks like at scale — Byrnihat is the answer.
📌 Key Takeaways
- Byrnihat was ranked the world’s most polluted city in 2024 by IQAir with PM2.5 at 128.2 µg/m³ — over 25× the WHO limit.
- It has been India’s most polluted city in 2023, 2024, and the first half of 2025 — consistently beating Delhi.
- The pollution comes from a combination of 80+ industrial units, heavy diesel trucks on NH-40, road dust, and bowl-shaped geography that traps emissions.
- A governance gap between Assam and Meghalaya has allowed polluters on both sides to operate without coordinated oversight.
- Factory shutdowns have had limited impact because road dust and traffic are unaddressed co-contributors.
- Residents face a health crisis — with a 40% rise in respiratory illness since 2018 — and an agricultural crisis, with local produce rejected by Guwahati markets.
- As of early 2026, some improvement has been noted on the Meghalaya side after red-category closures, but the town remains among the most polluted places on Earth.
Frequently Asked Questions About Byrnihat Pollution
Why is Byrnihat so polluted?
Byrnihat is polluted due to a combination of over 80 industrial units (including coke ovens, ferro-alloy plants, and cement factories), heavy diesel truck traffic on NH-40, road dust, and a bowl-shaped valley topography that traps emissions. Its location on the Assam–Meghalaya border also creates a governance gap, with two separate pollution control boards unable to coordinate enforcement effectively.
Why was Byrnihat ranked the world’s most polluted city?
Swiss air quality firm IQAir ranked Byrnihat the world’s most polluted city for 2024 in its annual World Air Quality Report released in March 2025. The town recorded an annual average PM2.5 concentration of 128.2 µg/m³ — the highest of any city or town globally that year, surpassing even Delhi and cities in Pakistan and China.
Where is Byrnihat located?
Byrnihat is located on the border of Meghalaya and Assam in Northeast India. It is approximately 14–20 km from Guwahati and 65–90 km from Shillong. The town falls under Ri-Bhoi district in Meghalaya and Kamrup Metropolitan district in Assam. National Highway 40 (NH-40, formerly NH-6) passes directly through the town.
What industries are responsible for Byrnihat’s pollution?
The main industries responsible for Byrnihat’s pollution are coke ovens and ferro-alloy plants (the biggest source of PM2.5), iron and steel units, cement factories, distilleries, and stone-crushing units. Most of the highest-pollution “red category” industries are located on the Assam side of the border.
Is Byrnihat more polluted than Delhi?
Yes. Byrnihat has been more polluted than Delhi every year since 2023. In 2024, Byrnihat’s annual average PM2.5 was 128.2 µg/m³ compared to Delhi’s 108.3 µg/m³. In the first half of 2025, the gap widened further — Byrnihat at 133 µg/m³ vs Delhi at 87 µg/m³. Delhi remains the world’s most polluted capital city, but Byrnihat has been ranked the world’s most polluted city overall.
What is the PM2.5 level in Byrnihat?
According to IQAir’s 2024 World Air Quality Report, Byrnihat’s annual average PM2.5 was 128.2 µg/m³. In the first half of 2025, CREA recorded an even higher average of 133 µg/m³. The WHO annual safe limit for PM2.5 is 5 µg/m³, making Byrnihat’s air roughly 25–26 times more polluted than the safe limit.
How does Byrnihat’s air quality compare with WHO standards?
Byrnihat’s PM2.5 level of 128.2 µg/m³ (2024 annual average) is more than 25 times the WHO annual guideline of 5 µg/m³ (revised in 2021). India’s own National Ambient Air Quality Standard (NAAQS) daily limit is 60 µg/m³ — Byrnihat exceeded even this limit on 278 of the 356 monitored days in 2024.
What health problems are caused by pollution in Byrnihat?
Documented health problems in Byrnihat include chronic respiratory diseases (asthma, bronchitis), eye irritation, skin rashes, tuberculosis, cardiovascular disease, and cancer with long-term exposure. Health data shows a 40% rise in respiratory illness in Ri-Bhoi district since 2018. Children, the elderly, and factory workers are at the highest risk.
Why do Assam and Meghalaya both play a role in Byrnihat’s pollution?
Byrnihat sits directly on the Assam–Meghalaya state border, with industrial units on both sides. Assam has 20 red-category (high-pollution) industries in the Byrnihat area vs 5 in Meghalaya. Each state’s pollution control board can only regulate its own side, creating a coordination gap where industrial emissions from one state affect the entire town but cannot be addressed by the other state’s authority.
What is the government doing to reduce pollution in Byrnihat?
Multiple actions have been taken: Byrnihat is listed as a non-attainment city under the National Clean Air Programme (NCAP) with a target of 40% PM reduction by 2026. Multiple rounds of factory inspections and closure notices have been issued. As of February 2026, 15 units on the Assam side have been shut. In December 2025, a new Continuous Ambient Air Quality Monitoring System (CAAQMS) was inaugurated. The NGT and Meghalaya High Court have also issued directions on the issue.
Have any factories in Byrnihat been shut down due to pollution?
Yes. Multiple rounds of closures have occurred. In September 2024, 6 non-compliant units were issued closure notices by MSPCB. In January–February 2025, 7 more units were shut for violations. As of February 2026, a total of 15 industrial units on the Assam side of the Byrnihat area have been shut down since the town topped global pollution rankings. However, these closures have not resulted in a significant improvement in overall air quality.
Is Byrnihat safe to live in?
No, Byrnihat is not currently safe to live in from an air quality perspective. With PM2.5 levels consistently more than 25 times the WHO safe limit, long-term residence significantly increases the risk of respiratory disease, cardiovascular disease, and cancer. Short-term visitors and residents should wear N95 masks, use indoor air purifiers, and limit outdoor activity during high-pollution periods.
What is the AQI in Byrnihat today?
For real-time AQI data, check the CPCB’s SAMEER app (available on Android and iOS) or IQAir’s website (iqair.com). AQI in Byrnihat has historically ranged from “Satisfactory” during off-peak months to “Severe” (300–400) during winter or high-traffic periods. The CAAQMS station inaugurated in December 2025 now provides more regular monitoring data from the Meghalaya side.
What is the difference between IQAir’s data and government pollution data?
IQAir reported Byrnihat’s 2024 annual PM2.5 average as 128.2 µg/m³, while Meghalaya’s MSPCB reported 50.1 µg/m³ for the same period. The difference is likely due to station placement — IQAir’s data comes from a station believed to be on the more heavily industrialised Assam side, while MSPCB’s stations are on the Meghalaya side. Both readings are dangerously above the WHO limit; the discrepancy highlights the need for comprehensive, multi-point monitoring across both sides of the border.
Has Byrnihat’s pollution improved in 2025–2026?
Only partially. The Meghalaya side has shown some moderation after red-category factory closures, with MSPCB’s chairman noting “moderate” levels on the Meghalaya side in January 2026. However, CREA data for the first half of 2025 showed Byrnihat’s PM2.5 at 133 µg/m³ — higher than 2024’s annual average. CREA also ranked Byrnihat as India’s most polluted city again in 2026 for the year 2025. Overall, there has been no sustained, measurable improvement.
Who monitors air quality in Byrnihat?
Air quality in Byrnihat is monitored by the CPCB (Central Pollution Control Board), the Meghalaya State Pollution Control Board (MSPCB), and the Assam Pollution Control Board, as well as by independent organisations like IQAir and CREA. A new CAAQMS (Continuous Ambient Air Quality Monitoring System) was inaugurated in the Ri-Bhoi district in December 2025 to improve real-time monitoring.
FAQ
Why is Byrnihat so polluted?
Byrnihat is polluted due to a combination of over 80 industrial units (including coke ovens, ferro-alloy plants, and cement factories), heavy diesel truck traffic on NH-40, road dust, and a bowl-shaped valley topography that traps emissions. Its location on the Assam–Meghalaya border also creates a governance gap, with two separate pollution control boards unable to coordinate enforcement effectively.
Why was Byrnihat ranked the world’s most polluted city?
Swiss air quality firm IQAir ranked Byrnihat the world’s most polluted city for 2024 in its annual World Air Quality Report released in March 2025. The town recorded an annual average PM2.5 concentration of 128.2 µg/m³ — the highest of any city or town globally that year, surpassing even Delhi and cities in Pakistan and China.
Where is Byrnihat located?
Byrnihat is located on the border of Meghalaya and Assam in Northeast India. It is approximately 14–20 km from Guwahati and 65–90 km from Shillong. National Highway 40 (NH-40) passes directly through the town.
What is the PM2.5 level in Byrnihat?
According to IQAir’s 2024 World Air Quality Report, Byrnihat’s annual average PM2.5 was 128.2 µg/m³. In the first half of 2025, CREA recorded 133 µg/m³. The WHO annual safe limit for PM2.5 is 5 µg/m³, making Byrnihat’s air roughly 25–26 times more polluted than the safe limit.
Is Byrnihat more polluted than Delhi?
Yes. Byrnihat has been more polluted than Delhi every year since 2023. In 2024, Byrnihat’s annual average PM2.5 was 128.2 µg/m³ vs Delhi’s 108.3 µg/m³. In H1 2025, Byrnihat was at 133 µg/m³ vs Delhi at 87 µg/m³.
What health problems are caused by pollution in Byrnihat?
Documented health problems in Byrnihat include chronic respiratory diseases, eye irritation, skin rashes, tuberculosis, cardiovascular disease, and cancer with long-term exposure. Health data shows a 40% rise in respiratory illness in Ri-Bhoi district since 2018.
Has Byrnihat’s pollution improved in 2025–2026?
Only partially. CREA data for the first half of 2025 showed Byrnihat’s PM2.5 at 133 µg/m³ — higher than 2024’s annual average of 128.2 µg/m³. CREA ranked Byrnihat as India’s most polluted city again in 2026 for the year 2025. The Meghalaya side has shown some moderation after factory closures, but no sustained improvement is evident overall.
What is the difference between IQAir’s data and government pollution data?
IQAir reported Byrnihat’s 2024 annual PM2.5 average as 128.2 µg/m³, while Meghalaya’s MSPCB reported 50.1 µg/m³. The difference is due to station placement — IQAir’s station is believed to be on the more industrialised Assam side. Both readings are dangerously above the WHO limit.
